
Antikörper-freie Zellfärbung mit der SNAP-tag Technologie
Die SNAP-tag Technologie für Antikörper-freies Live Cell Imaging und viele weitere Anwendungsgebiete ist nicht zuletzt durch den Nobelpreis für Chemie 2014 für Stefan Hell in den Fokus der Forscher gerückt.
Stefan Hell hat die SNAP-tag Technologie im Zusammenhang mit der STED-Mikroskopie eingesetzt und interessante Paper dazu verfasst.
Lernen auch Sie die überlegenen Vorteile der SNAP-tag Technologie für Ihre Forschung kennen und lieben.
Die SNAP-tag bzw. CLIP-tag Protein-Labeling Technologie von NEB bietet Ihnen eine einfache, schnelle und zuverlässige Methode zur antikörperfreien Markierung Ihres Zielproteins für unterschiedliche in vivo- und in vitro-Applikationen.
Das Prinzip ist so einfach wie clever:
Sie exprimieren Ihr Zielprotein als Fusion mit dem SNAP-tag. Dieser bindet dann kovalent und hochspezifisch ein markiertes Benzylguanin-Substrat Ihrer Wahl.

Der SNAP- oder CLIP-tag des Zielproteins bindet die gewünschte Markierung „X“ unter Abspaltung von Guanin bzw. Cytosin.
Workflow

Klonieren Sie Ihr Zielprotein als SNAP-tag Fusion. Nach transienter oder stabiler Transfektion und und Expression des Fusionsproteins geben Sie das SNAP-tag Substrat Ihrer Wahl dazu (hier: Fluoreszenz-Konjugat), welches durch Diffusion in die Zelle gelangt. Nach Waschen des ungebundenen Substrats ist Ihr Zielprotein kovalent mit dem Fluorophor verknüpft und bereit zur weitere Experimente (hier Mikroskopie).
SNAP-tag Einstieg leicht gemacht: Nutzen Sie gerne unsere Videotutorials
Fluorescent Labeling of COS-7 Expressing SNAP-tag® Fusion Proteins for Live Cell Imaging
Ein Konstrukt – Viele Anwendungen
Die SNAP-tag Technologie bietet Ihnen neben einfachem „Live Cell Imaging“ eine Reihe an exklusiven Anwendungen, die mit anderen Methoden, wie z.B. Antikörper-Anwendungen oder GFP-Fusionen, nicht möglich sind!
Die SNAP-tag Technologie ist besonders geeignet für Fragestellungen zu Protein-(Trans-)-Lokation, Rezeptor-Internalisierungen oder Protein-Dynamik.
SNAP-tag Substrate für verschiedene Applikationen:
NEB bietet Ihnen eine Vielzahl an SNAP-tag Substraten „ready to- use“ für Ihre Versuche an. Hier finden Sie Fluorophor-Konjugate unterschiedlicher Wellenlängen ebenso wie Beads oder Biotin-konjugiertiert Substrate.
Applikationen:
- Fluoreszenzmikroskopie (inkl. Super-Resolution)
- Pulse/Chase Studien in lebenden Zellen
- selektive Zelloberflächen-Markierung
- Durchflusszytometrie
- Proteinimmobilisation
- Pull-Down Assays, Protein-Arrays
- Aufreinigung
- Direkte Proteindetektion in SDS-PAGE
- Protein-Bindestudien
- FRET/HTRF Assays
- etc.
SNAP-tag:
Multiplex tagging Tools for the Study of Protein Dynamics and beyond

Eine vollständige Liste aller SNAP-Produkte inklusive aller verfügbaren Fluorophore finden Sie in der Broschüre „Cellular Imaging and Analysis“
Forschen Sie wie ein Nobelpreisträger
SNAP-tag Technologie in der STED-Mikroskopie und anderen Super-Resolution Systemen
Die SNAP-tag Technologie lässt sich neben der konfokalen Fluoreszenz-Mikroskopie auch hervorragend in modernen Super-Resolution Systemen nutzen.
Auch der Göttinger Nobelpreisträger Stefan Hell hat bereits mit SNAP-tag in STED publiziert:

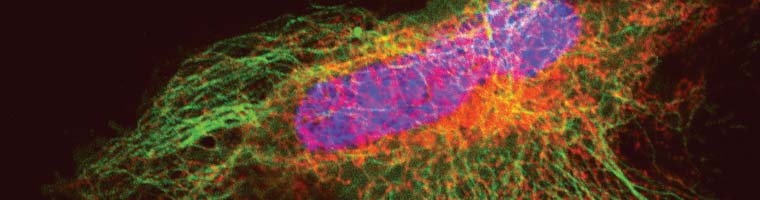
Konfokal bzw. STED- Mikroskopie an lebenden U2-OS Zellen: Zellen exprimieren das Mikrotubuli-bindende Cep41-SNAP-tag Fusionsprotein, nachgewiesen mit SNAP-Cell® 647SiR
Vergleich der SNAP-tag® / CLIP-tagTM Technologie mit GFP
Die SNAP-tag Technologie erscheint auf den ersten Blick der Verwendung von GFP-Fusionsproteinen (GFP = Green Fluorescent Protein) sehr ähnlich, in vielen Anwendungen hat diese Technologie aber entscheidende Vorteile.
Auch benötigen photoaktivierbare fluoreszente Proteine energiereiches Laser-Licht, welches unter Umständen zelluläre Mechanismen beeinflussen kann (z.B. Aktivierung der Apoptose).
| Anwendung | SNAP-tag/CLIP-tag | GFP bzw. andere fluoreszente Proteine |
|---|---|---|
| Untersuchung dynamischer Vorgänge in der Zelle | Die Markierung der Proteine erfolgt durch Zugabe des Substrat. | Die Fluroeszenz/ Farbe ist genetisch codiert und wird dauernd exprimiert. |
| Exklusive Markierung von Proteinen an der Zelloberfläche | Durch die Verwendung nicht-zellpermeabler Farbstoffe können exklusiv Proteine an der Zelloberfläche markiert werden. | Keine Möglichkeit der spezifischen Markierung von Protein-Subpopulationen an der Zelloberfläche. |
| Verwendung verschiedener Farbspektren zur Markierung | Das gleiche Konstrukt kann durch Verwendung verschiedener Substrate mit zahlreichen Farbstoffen markiert werden. | Um das gleiche Protein mit unterschiedlichen Farbstoffen zu markieren sind separate Klonierungen notwendig. |
| Untersuchung fixierter Zellen | Markierung wird durch die Fixierung nicht beeinflusst. | Fluoreszente Proteine sind häufig empfindlich gegenüber Fixativen. |
| Pulse-Chase Experimente | Die Markierung neu synthetisierter Proteine kann zwischenzeitlich durch Blockierungsreagenzien abgeschaltet werden. | Es ist nicht möglich, die Fluoreszenz neu synthetisierter Proteine gezielt abzuschwächen. |
| Pull-Down Versuche | SNAP-tag Fusionsproteine können durch Bindung an BG Beads aufgereinigt werden. | Nur durch Verwendung eines Anti-GFP Antikörper möglich. |
| PRODUKT | Art.Nr.: | GRÖSSE | INFO | |
|---|---|---|---|---|
| SNAP-Cell 430™ | S9109S | 50 nmol | ||
| SNAP-Cell 505-Star | S9103S | 50 nmol | ||
| SNAP-Cell Block™ | S9106S | 100 nmol | ||
| SNAP-Cell Oregon Green™ | S9104S | 50 nmol | ||
| SNAP-Cell TMR-Star™ | S9105S | 30 nmol | ||
| SNAP-Cell® 647SiR | S9102S | 30 nmol | ||
| SNAP-Surface 488™ | S9124S | 50 nmol | ||
| SNAP-Surface 549™ | S9112S | 50 nmol | ||
| SNAP-Surface 594 | S9134S | 50 nmol | ||
| SNAP-Surface Alexa Fluor® 488 | S9129S | 50 nmol | ||
| SNAP-Surface Alexa Fluor® 546™ | S9132S | 50 nmol | ||
| SNAP-Surface Alexa Fluor® 647™ | S9136S | 50 nmol | ||
| SNAP-Surface Block™ | S9143S | 200 nmol | ||
| SNAP-Surface® 649 | S9159S | 50 nmol | ||
| SNAP-tag™ Purified Protein | P9312S | 50 µg | ||
| SNAP-Capture Magnetic Beads™ | S9145S | 2 ml | ||
| SNAP-Capture Pull-Down Resin™ | S9144S | 2 ml | ||
| SNAP-Biotin™ | S9110S | 50 nmol | ||
| Anti-SNAP-tag Antibody (Polyclonal) | P9310S | 100 µl | ||
| CLIP-Biotin™ | S9221S | 50 nmol | ||
| CLIP-Cell 505™ | S9217S | 50 nmol | ||
| CLIP-Cell TMR-Star™ | S9219S | 30 nmol | ||
| CLIP-Surface 488™ | S9232S | 50 nmol | ||
| CLIP-Surface 547™ | S9233S | 50 nmol | ||
| CLIP-Surface 647™ | S9234S | 50 nmol | ||
| BG-GLA-NHS | S9151S | 2 mg | ||
| BG-Maleimide | S9153S | 2 mg | ||
| BG-PEG-NH2 | S9150S | 2 mg | ||
| pCLIPf Vector | N9215S | 20 µg | ||
| pSNAP-tag(T7)-2 Vector | N9181S | 20 µg | ||
| pSNAPf Vector | N9183S | 20 µg | ||
Stand 01.01.2024
Publikationen (klicken Sie zum Aufklappen)
Publikationen
Reviews
Lukinavičius, G. et al. (2015) „Fluorescent labeling of SNAP-tagged proteins in cells“ Methods Mol. Biol. 1266, 107-118.Corrêa Jr., I. R. (2015) „Considerations and protocols for the synthesis of custom protein labeling probes“ Methods Mol. Biol. 1266, 55-79.Corrêa Jr., I. R. (2014) „Live-cell reporters for fluorescence imaging“ Curr. Opin. Chem. Biol. 20, 36-45.
STEDGuzmán, C. et al. (2014) „The efficacy of Raf kinase recruitment to the GTPase H-ras depends on H-ras membrane conformer specific nanoclustering“ J. Biol. Chem. 289, 9519-9533.Stagge, F. et al. (2013) „Snap-, CLIP- and Halo-Tag Labelling of Budding Yeast Cells“ PLoS One 8(10): e78745.Lukinavičius, G. et al. (2013) „Selective Chemical Crosslinking Reveals a Cep57-Cep63-Cep152 Centrosomal Complex“ Curr. Biol. 23, 265-270.Lukinavičius, G. et al. (2013) „A near-infrared fluorophore for live-cell super-resolution microscopy of cellular proteins“ Nat. Chem. 5, 132-139.Pellett P. A. et al. (2011) „Two-color STED microscopy in living cells.“ Biomed. Opt. Expr. 2, 2364-2371.Testa I. et al. (2010) „Multicolor Fluorescence Nanoscopy in Fixed and Living Cells by Exciting Conventional Fluorophores with a Single Wavelength“ Biophys. J. 99, 2686-94.Hein B. et al. (2010) „Stimulated Emission Depletion Nanoscopy of Living Cells Using SNAP-Tag Fusion Proteins.“ Biophys. J. 98, 158–163.
STORMLiu, Z. et al. (2014) „Super-resolution imaging and tracking of protein-protein interactions in sub-diffraction cellular space“ Nat. Commun. 5, 4443.Perkovic, M. et al. (2014) „Correlative Light- and Electron Microscopy with chemical tags“ J. Struct. Biol. 186, 205-213.Carlini, L. et al. (2014) „Reduced Dyes Enhance Single-Molecule Localization Density for Live Superresolution Imaging“ ChemPhysChem 15, 750-755.Sateriale, A. et al. (2013) „SNAP-Tag Technology Optimized for Use in Entamoeba histolytica“ PLoS One 8(12), e83997.Lukinavičius, G. et al. (2013) „A near-infrared fluorophore for live-cell super-resolution microscopy of cellular proteins“ Nat. Chem. 5, 132-139.Malkusch, S. et al. (2013) „Single-molecule coordinate-based analysis of the morphology of HIV-1 assembly sites with near-molecular spatial resolution“ Histochem. Cell Biol. 139, 173-179.van de Linde, S. et al. (2011) „Direct stochastic optical reconstruction microscopy with standard fluorescent probes“ Nat. Protoc. 6, 991-1009.Eckhardt M. et al. (2011) „A SNAP-Tagged Derivative of HIV-1-A Versatile Tool to Study Virus-Cell Interactions.“ PLoS One 6(7), e22007.Jones S. A. et al. (2011) „Fast, three-dimensional super-resolution imaging of live cells.“ Nat. Methods 8, 499-505.Klein T. et al. (2011) „Live-cell dSTORM with SNAP-tag fusion proteins.“ Nat. Methods 8, 7-9.Dellagiacoma C. et al. (2010) „Targeted Photoswitchable Probe for Nanoscopy of Biological Structures“ ChemBioChem 11, 1361–1363.
PALMBenke, A. et al. (2012) „Multicolor Single Molecule Tracking of Stochastically Active Synthetic Dyes“ Nano Lett. 12, 2619-2624.Banala, S. et al. (2012) „A caged, localizable rhodamine for superresolution microscopy“ ACS Chem. Biol. 7, 289-293
RLS-SRMZhao, Z. W. et al. (2014) „Spatial organization of RNA polymerase II inside a mammalian cell nucleus revealed by reflected light-sheet superresolution microscopy“ Proc. Natl. Acad. Sci. USA 111, 681-686.
Tissue and Animal Imaging:
Yang, G. et al. (2015) „Genetic targeting of chemical indicators in vivo“ Nat. Methods 12, 137-139.Kohl, J. et al. (2014) „Ultrafast tissue staining with chemical tags“ Proc. Natl. Acad. Sci. USA 111, E3805-E3814.Ivanova, A. et al. (2013) „Age-dependent labeling and imaging of insulin secretory granules“ Diabetes 62, 3687-3696.Gong, H. et al. (2012) „Near-Infrared Fluorescence Imaging of Mammalian Cells and Xenograft Tumors with SNAP-Tag“ PLoS ONE 7(3): e34003.Bojkowska K. et al. (2011) „Measuring in vivo protein half-life.“ Chem. Biol. 18, 805-815.
Cell-Surface Protein Labeling and Internalization Analysis:
Bitsikas, V. et al. (2014) „Clathrin-independent pathways do not contribute significantly to endocytic flux“ eLife 3, e03970.Jaensch, N. et al. (2014) „Stable Cell Surface Expression of GPI-Anchored Proteins, but not Intracellular Transport, Depends on their Fatty Acid Structure“ Traffic 15, 1305-1329.Cole, N. B. and Donaldson, J. G. (2012) „Releasable SNAP-tag Probes for Studying Endocytosis and Recycling“ ACS Chem. Biol. 7, 464-469.
Pulse-Chase Analysis:
Rošić, S. et al. (2014) „Repetitive centromeric satellite RNA is essential for kinetochore formation and cell division“ J. Cell Biol. 207, 335-349.Stoops, E. H. et al. (2014) „SNAP-Tag to Monitor Trafficking of Membrane Proteins in Polarized Epithelial Cells“ Methods Mol. Biol. 1174, 171-182.Bordor, D. L. et al. (2012) „Analysis of Protein Turnover by Quantitative SNAP-Based Pulse-Chase Imaging“ Curr. Protoc. Cell Biol. 55, 8.8.1-8.8.34.
Pull-Down Studies:
Register, A. C. et al. (2014) „SH2-Catalytic Domain Linker Heterogeneity Influences Allosteric Coupling across the SFK Family“ Biochemistry 53, 6910-6923.Shi, G. et al. (2012) „SNAP-tag based proteomics approach for the study of the retrograde route“ Traffic 13, 914-925.Bieling, P. et al. (2010) „A minimal midzone protein module controls formation and length of antiparallel microtubule overlaps“ Cell 142, 420-432.
Protein-Protein and Protein-Ligand Interactions:
Griss, R. et al. (2014) „Bioluminescent sensor proteins for point-of-care therapeutic drug monitoring“ Nat. Chem. Biol. 10, 598-603.Chidley, C. et al. (2011) „A yeast-based screen reveals that sulfasalazine inhibits tetrahydrobiopterin biosynthesis.“ Nat. Chem. Biol. 7, 375-383.Gautier A. et al. (2009) „Selective Cross-Linking of Interacting Proteins using Self-Labeling Tags“ J. Am. Chem. Soc. 131, 17954-17962.Maurel D. et al. (2008) „Cell-surface protein-protein interaction analysis with time-resolved FRET and SNAP-tag technologies: application to GPCR oligomerization.“ Nat. Methods 5, 561-567.
Troubleshooting
Troubleshooting
| Applikation | Problem | Möglicher Grund | Lösung |
| Zellfärbung | Keine Färbung | Fusionsprotein wurde nicht exprimiert | Transfektion überprüfen Expression des Fusionsproteins mittels Western oder SDS-PAGE (Vista Green) |
| Schwache Färbung | Ungenügende Substrat-Inkubation | Substratkonzentration erhöhenInkubationszeit verlängern | |
| Geringe Expression und/oder hoher Turnover des Zielproteins | Samples unmittelbar nach der Färbung analysieren | ||
| Hoher Hintergrund | Unspezifische Bindung desSubstrates | Substratkonzentration verringernInkubationszeit verkürzenZugabe von FCS oder BSA während der Färbung | |
| Signal verschwindetinnerhalb kurzer Zeit | Fusionsprotein ist nicht stabil | Zellen fixierenTag vom N-terminus zum C-terminus verlagern (und vice-versa) | |
| Photobleaching | Zugabe von Anti-Fade ReagentBelichtungszeit und/oder -Intensität verkürzen | ||
| in-vitroFärbung | Präzipitation | Unlösliche Fusion |
|
| Hoher Hintergrund | Farbstoff adsorbiert Fusionsprotein | Zugabe von 0.05 – 0.1% Tween20 | |
| Schwache oderfehlende Färbung | Substat wurde nicht im Überschusszugegeben |
|
|
| Signal verschwindetinnerhalb kurzerZeit | Fusionsprotein ist nicht stabil |
|
Weiterführende Informationen finden Sie unter Technische Ressourcen oder auf neb.com. Informationen zu Namensrechten finden Sie hier.