
SNAP-tag Technology
SNAP- and CLIP-tag protein labeling systems enable the specific, covalent attachment of virtually any molecule to a protein of interest. There are two steps to using this system: cloning and expression of the protein of interest as a SNAP-tag® fusion, and labeling of the fusion with the SNAP-tag substrate of choice. The SNAP-tag is a small protein based on human O6-alkylguanine-DNA-alkyltransferase (hAGT), a DNA repair protein.
SNAP-tag substrates are dyes, fluorophores, biotin, or beads conjugated to guanine or chloropyrimidine leaving groups via a benzyl linker. In the labeling reaction, the substituted benzyl group of the substrate is covalently attached to the SNAP-tag. CLIP-tag™ is a modified version of SNAP-tag, engineered to react with benzylcytosine rather than benzylguanine derivatives. When used in conjunction with SNAP-tag, CLIP-tag enables the orthogonal and complementary labeling of two proteins simultaneously in the same cells.
Applications
- Simultaneous dual protein labeling inside live cells
- Protein localization and translocation
- Pulse-chase experiments
- Receptor internalization studies
- Selective cell surface labeling
- Protein pull-down assays
- Protein detection in SDS-PAGE
- Flow cytometry
- High throughput binding assays in microtiter plates
- Biosensor interaction experiments
- FRET-based binding assays
- Single molecule labeling
- Super-resolution microscopy

The SNAP- or CLIP-tag is fused to the protein of interest. Labeling occurs through covalent attachment to the tag, releasing either a guanine or a cytosine moiety.
Workflow

Clone and express your protein of interest fused to the SNAP-tag once, then use with a variety of substrates for subsequent analysis.
Videotutorial
Fluorescent Labeling of COS-7 Expressing SNAP-tag® Fusion Proteins for Live Cell Imaging
SNAP-tag:
Multiplex tagging Tools for the Study of Protein Dynamics and beyond

A complete list of all SNAP products including all available Fluorophores can be found in our brochure „Cellular Imaging and Analysis“
Nobel Prize in Chemistry 2014
The Nobel Prize in Chemistry 2014 was awarded to Stefan Hell, Goettingen, who has also used the SNAP-tag for his STED studies:

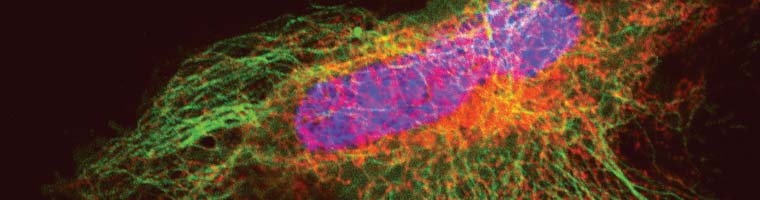
Confocal vs. STED microscopy of living U2-OS cell:
The cells overexpress a SNAP-tag fusion of Cep41, a microtubuli binding protein. SNAP-Cell® 647SiR was used to detect the fusion protein.
Lukinavičius G et al. (2013) “A near-infrared fluorophore for live-cell super-resolution microscopy of cellular proteins.” Nat. Chem. 5(2): 132-9.
Comparison of SNAP-tag® / CLIP-tagTM Technologies to GFP
While SNAP/CLIP-tag technologies are complementary to GFP, there are several applications for which SNAP- and CLIP-self-labeling technologies are advantageous.
| Application | SNAP-tag/CLIP-tag | GFP and other fluorescent proteins |
|---|---|---|
| Time-resolved fluorescence | Fluorescence can be initiated upon addition of label | Color is genetically encoded and always expressed. Also, photoactivatable fluorescent proteins require high intensity laser light, which may activate undesired cellular pathways (e.g., apoptosis) |
| Pulse-chase analysis | Labeling of newly synthesized proteins can be turned off using available blocking reagents (e.g., SNAP-Cell Block) | Fluorescence of newly synthesized proteins cannot be quenched to investigate dynamic processes |
| Ability to change colors | A single construct can be used with different dye substrates to label with multiple colors | Requires separate cloning and expression for each color |
| Surface specific labeling | Can specifically label subpopulation of target protein expressed on cell surface using non-cell permeable substrates | Surface subpopulation cannot be specifically visualized |
| Visualizing fixed cells | Resistant to fixation, strong labeling | Labile to fixation; weak labeling |
| Pull-down studies | “Bait” proteins can be covalently captured on BG beads | Requires anti-GFP antibody to non-covalently capture “bait” protein, complicating downstream analysis |
| Live animal imaging | Near-IR dyes are available, permitting deep tissue visualization | Limited to visible wavelengths |
| PRODUCT | Prod.Nr.: | SIZE | INFO | |
|---|---|---|---|---|
| SNAP-Cell 430™ | S9109S | 50 nmol | ||
| SNAP-Cell 505-Star | S9103S | 50 nmol | ||
| SNAP-Cell Block™ | S9106S | 100 nmol | ||
| SNAP-Cell Oregon Green™ | S9104S | 50 nmol | ||
| SNAP-Cell TMR-Star™ | S9105S | 30 nmol | ||
| SNAP-Cell® 647SiR | S9102S | 30 nmol | ||
| SNAP-Surface 488™ | S9124S | 50 nmol | ||
| SNAP-Surface 549™ | S9112S | 50 nmol | ||
| SNAP-Surface 594 | S9134S | 50 nmol | ||
| SNAP-Surface Alexa Fluor® 488 | S9129S | 50 nmol | ||
| SNAP-Surface Alexa Fluor® 546™ | S9132S | 50 nmol | ||
| SNAP-Surface Alexa Fluor® 647™ | S9136S | 50 nmol | ||
| SNAP-Surface Block™ | S9143S | 200 nmol | ||
| SNAP-Surface® 649 | S9159S | 50 nmol | ||
| SNAP-tag™ Purified Protein | P9312S | 50 µg | ||
| SNAP-Capture Magnetic Beads™ | S9145S | 2 ml | ||
| SNAP-Capture Pull-Down Resin™ | S9144S | 2 ml | ||
| SNAP-Biotin™ | S9110S | 50 nmol | ||
| Anti-SNAP-tag Antibody (Polyclonal) | P9310S | 100 µl | ||
| CLIP-Biotin™ | S9221S | 50 nmol | ||
| CLIP-Cell 505™ | S9217S | 50 nmol | ||
| CLIP-Cell TMR-Star™ | S9219S | 30 nmol | ||
| CLIP-Surface 488™ | S9232S | 50 nmol | ||
| CLIP-Surface 547™ | S9233S | 50 nmol | ||
| CLIP-Surface 647™ | S9234S | 50 nmol | ||
| BG-GLA-NHS | S9151S | 2 mg | ||
| BG-Maleimide | S9153S | 2 mg | ||
| BG-PEG-NH2 | S9150S | 2 mg | ||
| pCLIPf Vector | N9215S | 20 µg | ||
| pSNAP-tag(T7)-2 Vector | N9181S | 20 µg | ||
| pSNAPf Vector | N9183S | 20 µg | ||
As of: 01.01.2024
Publications (click to expand)
Publications
STED
Guzmán, C. et al. (2014) “The efficacy of Raf kinase recruitment to the GTPase H-ras depends on H-ras membrane conformer specific nanoclustering” J. Biol. Chem. 289, 9519-9533. Stagge, F. et al. (2013) “Snap-, CLIP- and Halo-Tag Labelling of Budding Yeast Cells” PLoS One 8(10): e78745. Lukinavičius, G. et al. (2013) “Selective Chemical Crosslinking Reveals a Cep57-Cep63-Cep152 Centrosomal Complex” Curr. Biol. 23, 265-270. Lukinavičius, G. et al. (2013) “A near-infrared fluorophore for live-cell super-resolution microscopy of cellular proteins” Nat. Chem. 5, 132-139. Pellett P. A. et al. (2011) “Two-color STED microscopy in living cells.” Biomed. Opt. Expr. 2, 2364-2371. Testa I. et al. (2010) “Multicolor Fluorescence Nanoscopy in Fixed and Living Cells by Exciting Conventional Fluorophores with a Single Wavelength” Biophys. J. 99, 2686-94. Hein B. et al. (2010) “Stimulated Emission Depletion Nanoscopy of Living Cells Using SNAP-Tag Fusion Proteins.” Biophys. J. 98, 158–163.
STORM
Liu, Z. et al. (2014) “Super-resolution imaging and tracking of protein-protein interactions in sub-diffraction cellular space” Nat. Commun. 5, 4443. Perkovic, M. et al. (2014) “Correlative Light- and Electron Microscopy with chemical tags” J. Struct. Biol. 186, 205-213. Carlini, L. et al. (2014) “Reduced Dyes Enhance Single-Molecule Localization Density for Live Superresolution Imaging” ChemPhysChem 15, 750-755. Sateriale, A. et al. (2013) “SNAP-Tag Technology Optimized for Use in Entamoeba histolytica” PLoS One 8(12), e83997. Lukinavičius, G. et al. (2013) “A near-infrared fluorophore for live-cell super-resolution microscopy of cellular proteins” Nat. Chem. 5, 132-139. Malkusch, S. et al. (2013) “Single-molecule coordinate-based analysis of the morphology of HIV-1 assembly sites with near-molecular spatial resolution” Histochem. Cell Biol. 139, 173-179. van de Linde, S. et al. (2011) “Direct stochastic optical reconstruction microscopy with standard fluorescent probes” Nat. Protoc. 6, 991-1009. Eckhardt M. et al. (2011) “A SNAP-Tagged Derivative of HIV-1-A Versatile Tool to Study Virus-Cell Interactions.” PLoS One 6(7), e22007. Jones S. A. et al. (2011) “Fast, three-dimensional super-resolution imaging of live cells.” Nat. Methods 8, 499-505. Klein T. et al. (2011) “Live-cell dSTORM with SNAP-tag fusion proteins.” Nat. Methods 8, 7-9. Dellagiacoma C. et al. (2010) “Targeted Photoswitchable Probe for Nanoscopy of Biological Structures” ChemBioChem 11, 1361–1363.
PALM
Benke, A. et al. (2012) “Multicolor Single Molecule Tracking of Stochastically Active Synthetic Dyes” Nano Lett. 12, 2619-2624. Banala, S. et al. (2012) “A caged, localizable rhodamine for superresolution microscopy” ACS Chem. Biol. 7, 289-293
RLS-SRM
Zhao, Z. W. et al. (2014) “Spatial organization of RNA polymerase II inside a mammalian cell nucleus revealed by reflected light-sheet superresolution microscopy” Proc. Natl. Acad. Sci. USA 111, 681-686.
Troubleshooting
Troubleshooting
Application |
Problem |
Possible Cause |
Solution |
Cellular Labeling |
No labeling | Fusion protein not expressed |
|
| Weak labeling | Poor expression and/or insufficient exposure of fusion protein to substrate |
|
|
| Rapid turnover of fusion protein |
|
||
| High background | Non-specific binding of substrates |
|
|
| Signal strongly reduced after short time | Instability of fusion protein |
|
|
| Photobleaching |
|
||
Labeling in Solution |
Precipitation | Insoluble fusion |
|
| Weak or no labeling | Exhaustive labeling has not been achieved |
|
|
| Loss of activity | Instability of fusion protein |
|
Further information can be found in our Technical Resources section or at neb.com. Information on trademarks can be found here.